Disclaimer & Copyright Notices;
Optimized for the MS Edge
![[Img-animated graph]](../VIEW/ICON/AN/graph.gif)
TP/Cha
Predictive Models
Soil & Water Conservation Society of
Metro Halifax (SWCSMH)
Updated: May 13, 2020

© S.M. Mandaville
Post-Grad Dips. (lakescience outlook.com)
The citation for this documentation is:
Mandaville, S.M. TP/Cha
Predictive Models. Nova Scotia, Canada. Electronic media.
Contents:
Introduction
See also Selection of Phosphorus
Loading Model
for Nova Scotia- Phase I.
Predictive TP modelling
was based primarily on the following: extensive decadal research
spearheaded by several international peers in limnology under the
chairmanship of Richard A. Vollenweider PhD, formerly of the Canada
Centre for Inland Waters, Environment Canada, which culminated with the
consensus OECD (1982)- Organisation
for Economic Co-Operation and Development Report; on the Vollenweider(1976) TP
Predictive Model; and the published research of Peter J. Dillon FRSC et
al., formerly of the Dorset Research Centre, Ontario Ministry of
the Environment.
In addition,
Mandaville has
been incorporating other regressions published in the latest
international limnological journals as deemed necessary. This process will take several years for model
revisions as well as calibrations.
The natural
background (+
direct aerial deposition) concentrations were computed utilizing
published export coefficients in generally undisturbed similar natural
soils in Nova Scotia (cf., Hart et al, 1978; Mandaville, 2000; Scott et
al, 2000;
Scott et al, 2003);
the post-development concentrations were obtained utilizing published
export coefficients (end-of-pipe mean year averages) of typical
residential and commercial/institutional developments (cf.,
Mandaville, 2000;
Scott et al, 2003;
Vokey, 1998; and typical pollutants in
stormwater runoff).
With respect
to areas served by
septic
systems, our revised models did not incorporate the same assumptions as
in Hart et al (1978)
and Scott et al (2003) where the authors assumed
50% septic-derived phosphorus retention within 300m
of lakes in the Halifax/Wolfville soils. In
the Scott et al (2003)
report where Mandaville was a co-author, there was an inadvertent
omission made by not noting this down (and Mandaville regrets that).
Our export coefficients in such areas include all potential sources of
phosphorus inputs incorporated into the 50% export assumption; it
actually varied from 50% in some watersheds based on local info.
As a worst case scenario, 0% retention may be assumed for the long term as per the Province of Ontario's guidelines, "Protecting Water Quality in Inland Lakes on Ontario’s Precambrian Shield" (2010).
Table: Trophic
characterisation of lakes impairment of various uses
(Vollenweider
and Kerekes, 1982)
| Limnological characterisation |
Oligotrophic |
Mesotrophic |
Eutrophic |
| General level of production ........ |
low |
medium |
high |
| Biomass ............ |
low |
medium |
high |
| Green and/or blue-green algae fractions |
low |
variable |
high |
| Hypolimnetic oxygen content ..... |
high |
variable |
low |
| Impairment of multi-purpose use of lake |
little |
variable |
great |
Predictive
graphical models utilized
Predictive graphical models are constructed with the EasyPlot software utilizing the data in our MS Excel spreadsheet models, the latter being `dynamic'. The world renown and internationally used base
models are the Organization for
Economic Co-Operation and Development (OECD)'s Management Model, and
the Vollenweider (1976) Model. These graphs
visually depict the modelled theoretical as well as any relevant
`recent' field values, hence, serve as superb bases.
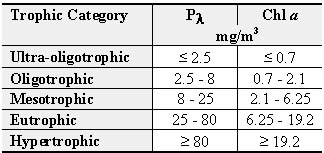
This model synthesizes the standard OECD
equations for the relationships between average inflow phosphorus
concentration (Pj), expected average lake concentration Pλ,
and expected average chlorophyll concentration (Cha) as a function of
the average water residence time T(w). The model also gives approximate
indications of the expected trophic category.
As these categories are
management oriented, they are slightly more stringently defined (i.e.,
approximately at the class midpoints) than are the categories used for
diagnostic purposes. This provides a certain safety margin for the
design of the loading objectives. Since the model requires the
hydraulic residence time as one of the axes, it is not possible to plot
most lakes due to insufficient bathymetric data.
Although this model pre-dates the above OECD
(1982) Model, in most
cases it is more appropriate since one of the axes-variables, qs (areal
water load) is available for all lakes. In order to incorporate the
probabilistic scenario, the management categories from the OECD (1982)
model have been incorporated into this model.
When possible and relevant, lakes with sufficient bathymetric data were
plotted on both of the above models.
Nomenclature:
Background
-plus- aerial deposition (B+A):
The theoretical background loading -plus-
direct aerial deposition have
been noted as "Th B+A", and in clearwater lakes it is expected that
these were the natural background values including direct aerial
deposition.
Recent development scenario:
Onsites- those existing within 300 m
of all watercourses inclusive of
upstream areas (Dillon and
Rigler, 1975; Dillon et
al., 1986; and Dillon et
al., 1994).
Urban/Serviced- existing developed areas in the watersheds with
sanitary sewerage exported out of the watershed.
Sewage Treatment Plant (STP) contributions taken into account.
Future development scenario:
- Onsite disposal systems:
- F-P (Future Probable)= lands within 300m of all lakes developed
with onsite systems @ 2.5 lots/ha density.
- F-U (Future Ultimate)= F-P scenario + lands within 300m of all
streams developed with onsite systems @ 2.5 lots/ha.
- Future Sewage Treatment Plant (STP) contributions taken into
account.
- Urban/Serviced (watersheds developed as residential- sanitary
sewerage exported out of the watershed):
- F-P (Future Probable)= Urban/serviced area export coeff. @ 0.52
kg/ha.yr (Waller, 1977;
and Vokey,
1998).
- F-U (Future Ultimate)= Urban/serviced area export coeff. @ 1.1
kg/ha.yr (Waller and
Novak, 1981).
No scientifically based allowance was made to take into account
the highly biological nature of the effluent from STPs, although the
lower removal efficiencies from Myers and Harding (1983) were applied
when possible.
Notes of caution:
- Contribution from humans to sanitary sewage systems- Our original
models assumed 0.8 kg/capita/yr TP based on the Ontario models from the
1970's to the 1990's. Ontario reported lower values of 0.66
kg/capita/yr in 2006 due primarily to decreases in the phosphorus
content of detergents. We have now updated most predictive models in Excel. Though, we
have not revised the graphical models, but the pre-cultural values
would not change.
- Regarding pets (dogs and cats), the contribution can be computed based on the relative body weights in
comparison with an average human being. Most of this would be
contributed via stormwater inputs.
- For contributions from waterfowl, peruse our submission to the Halifax
Watershed Advisory Board in year-2000.
- The predictive
modelling does not take into account potential large inputs of
phosphorus from failing pumping stations, bypasses
from treatment plants/pumping stations, cross-connections between sanitary and storm
sewers, and other unforeseen sources. But if a value is known, it can
easily be added in the `miscellaneous' column of the control
spreadsheets.

We salute the Chebucto
Community Net (CCN) of Halifax, Nova Scotia, Canada for
hosting our web site, and we applaud its volunteers for their devotion
in making `CCN' the best community net in the world!