Disclaimer & Copyright Notices; Optimized for the MS Edge
Soil & Water Conservation Society of Metro Halifax (SWCSMH)
Updated: April 12, 2019
![]()
What emerged from the assessment of all information available, however, led to the conclusion that there is no possibility of defining strict boundary values between trophic categories. Whilst the progression from oligo- to eutrophy is a gliding one- as has been stressed many times in literature- any one combination of trophic factors, in terms of trophic category allocation, can only be used in a probabilistic sense. Objective reasons exist for the uncertainty of classifying a given lake in different categories by two or more investigators, depending on the management of that body of water.
Average conditions, expressed by "average nutrient concentrations", "average biomass values", "average transparency", etc., do not necessarily express the degree of variability, particularly with regard to peak levels, frequency of their occurence, and their qualitative nature (type of phytoplankton).
From the management viewpoint, such situations and their frequency are as important as average conditions.
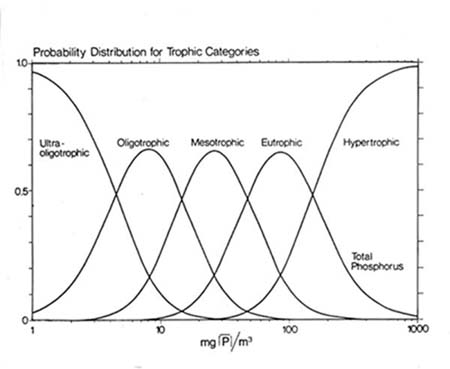
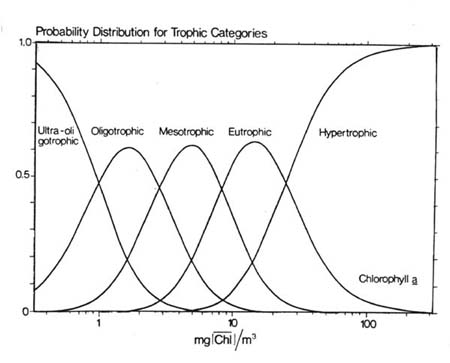
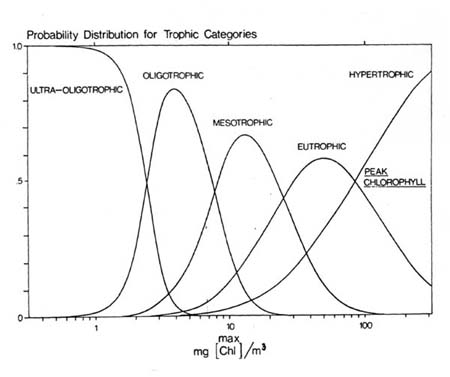
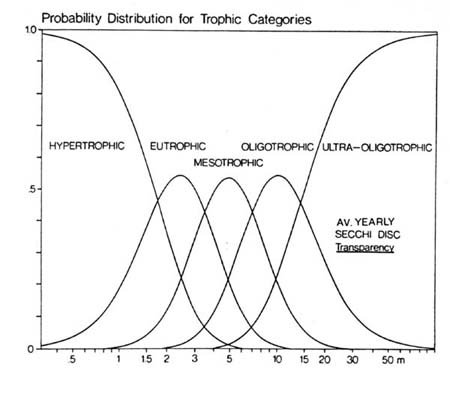
For this reason, prediction uncertainties must be accounted for. This can be achieved by reinterpreting the summary values listed in Table-3 in terms of classification probabilities. The resulting probability distribution is given in Figures 3 to 6 for the main components: average lake phosphorus, average and peak chlorophyll concentrations and average yearly Secchi disk transparency.
 Click on the mp3 sound file
(4-minute duration) to listen to the rationale behind the OECD
Probability Distribution Diagrams relating to the scientifically
credible methodology of ascertaining trophic states which can be
achieved only in a `probabilistic sense' as described above.
Click on the mp3 sound file
(4-minute duration) to listen to the rationale behind the OECD
Probability Distribution Diagrams relating to the scientifically
credible methodology of ascertaining trophic states which can be
achieved only in a `probabilistic sense' as described above.
Environment Canada's Dr. Richard Vollenweider has been the first Canadian (1986/7) to have ever received the top international medal in limnology, the Naumann-Thienemann medal.
![[Img-probability-example-1]](PIC/probability-example-1.jpg)
![]()
We salute the Chebucto Community Net (CCN) of Halifax, Nova Scotia, Canada for hosting our web site, and we applaud its volunteers for their devotion in making `CCN' the best community net in the world