Disclaimer & Copyright Notices; Optimized for the MS Internet Explorer
Water Management
Research of the Organization for Economic Co-Operation and Development (OECD)
Soil & Water Conservation Society of Metro Halifax (SWCSMH)
Updated:
August 12, 2015

(cf. Horner & Associates Ltd., 1995; Mandaville, 2000; Vollenweider, 1976; and Vollenweider and Kerekes, 1982)
Contents:
Lake Management- Quality objectives as a function of its intended use
Excessive supply of phosphorus in water is
the cause of eutrophication, yet phosphorus in itself does not
interfere with the normal use of water.
The trophic responses caused by the nutrient enrichment such as high
algal biomass, dense growth of macrophytes, reduced transparency, and
reduced hypolimnetic or oxygen concentrations under ice cover are
symptoms of eutrophication which do interfere with normal use of the
water. Therefore, water management should consider water quality
objectives in terms of trophic response objectives, with regard to the
intended use of the water.
These objectives may vary
considerably between different regions, depending on local conditions
and on the expectation of the population concerning water quality.
Depending on the intended use (e.g., drinking water, industrial water,
power plant cooling water, recreation, multiple use, etc.), the
stringency of objectives could be set at various levels, considering
algal biomass (chlorophyll a) as a trophic response indicator, i.e.:
- Mean algal biomass (annual, ice-free season, summer) to be kept below a certain level;
- Mean annual peak algal biomass to be kept below a certain level;
- Exceptional (highest possible) annual peak biomass to be kept below a certain level.
Predictive Models
- Although predictive models are not perfect, neither are measurements.
- Actual biological conditions in a lake vary from year
to year, as a result of climatic and other environmental variations.
Field sampling and, in the case of TP and Cha, laboratory analysis are not perfect processes and involve a degree of error.
- For these reasons, when used as a basis for lake
management decisions, measured data should represent the means of large
numbers of samples over long periods of time; therefore the estimates
generated by a well calibrated model based on current use and
development conditions can be taken as representing the long term means
around which measurements, if available, would vary.
- This is ofcourse an ideal world, and in the real world of large and
complex systems, this claim of accuracy cannot be made in all cases.
- Even if there is a significant gap between the predicted and
measured trophic state indicators for a particular lake, and some doubt
surrounds the absolute value of the predicted indicators, the models
will still indicate the relative change in trophic state that would
result from a given change in conditions.
- The planning agency may pick any intermediate level of TP or Cha
from the predictive models should it so desire subsequent to intensive
public consultations. Based on the predicted values, the agency could
set the densities as follows:
- In the case of areas served with on-site sewage disposal
systems, a maximum number of allowable systems within 300 metres of
lake shores could be ascertained. 300 metres is an approximate
compromise value and has withstood the test of time in Ontario, Nova
Scotia and elsewhere in North America.
- In the case of areas served with sewered systems,
controls could be placed on the amount of impervious areas as well as
the agency could require total stormwater systems, for e.g., specially
constructed (or engineered) wetlands together, not either/or, with a
pre-detention basin. The latter will remove larger particles, and the
wetland would act as a polishing device for removal/reduction of
smaller particles as well as dissolved pollutants.
- The pollutants are not just total phosphorus alone, but are a whole
range of post-development post-human-occupation inevitable generation
of pollutants.
OECD Management Model (Vollenweider and Kerekes, 1982):
Table-4: Management Model- yearly averages
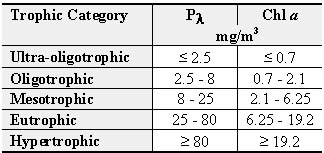
In this system, the trophic categories are
slightly more stringently defined (i.e., approximately at the class
midpoints) than are the categories used for diagnostic purposes. This
provides a certain safety margin for the design of the loading
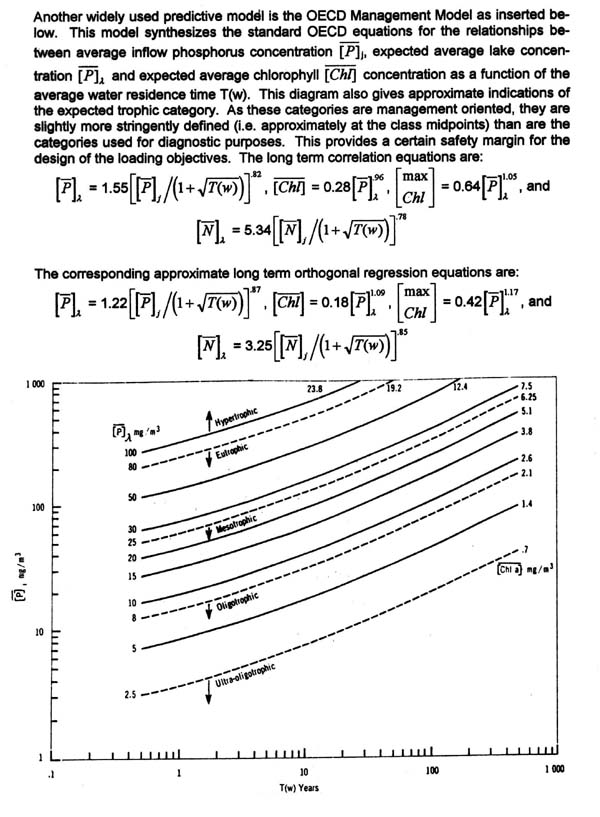
objectives. The OECD Management Model together with the long term
correlation equations are depicted in Figure-7 below.
Figure-7: OECD Management Model together with the long term correlation equations
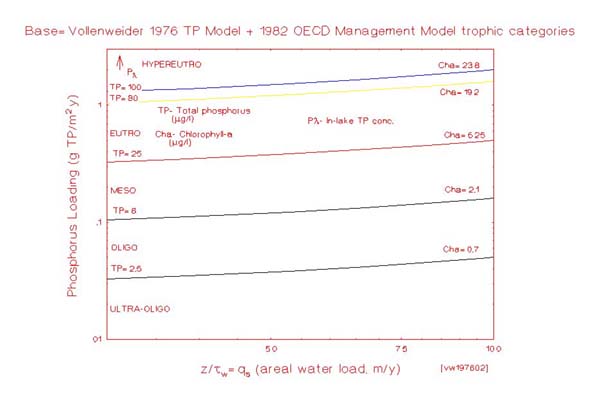
Vollenweider 1976 Model (Vollenweider, 1976):
The OECD (1982) regressions above need the water residence time, τw,
which in turn would imply mean depth. In many cases, mean depths of
lakes are not available. In such cases, this older model, which was
also a part of the OECD programme, may be used with the appropriate
trophic categories, preferably the OECD (1982) Management Model,
plotted on the graphs. Though, one could in reality plot any other
categories as well. (cf. Figure-8 below).
The model is:
Lc (mg/m�.y) = Pcsp (z/τw + 10), where
Lc is the critical loading of phosphorus,
Pcsp is the critical concentration of total phosphorus (mg/m�) for simplicity taken at spring overturn,
z is the mean depth, and
τw the water residence time
In this model, z/τw = qs
represents the hydraulic load which is independant of mean depth. It
can be argued however that the model ignores, or at least
underestimates, the effect of mean depth, i.e., the dilution function.
Figure-8:
An example of the Vollenweider (1976) Model with the OECD (1982)
Management Model trophic categories superimposed (Mandaville, 2000):
Some sensitive areas and exceptions in modelling:
- The prediction of lake concentration
should be given with statistical confidence limits to reflect more
realistically the uncertainties in the model prediction.
- The models assume steady state conditions in a completely "mixed reactor".
- It is unlikely that individual loading estimates are more accurate than � 35%.
- The nutrient loading models give an estimation of average
conditions; local conditions may deviate considerably, temporally
and/or spatially.
- The empirical phosphorus loading models should be used only
for water bodies within the range of conditions (hydrologic,
morphometric, trophic and climatic) represented by each of the model
development data set.
- A steady state on an annual basis is assumed in the models.
This is seldom the case, even in undisturbed natural systems,
considerable year to year variations in nutrient load are detected due
to fluctuations in annual runoff as well as in the nutrient loads.
- The models assume that the basin is open and that there is an
annual water surplus or outflow from the lake (the models cannot be
applied without modification to closed basins or arid and semi-arid
regions).
- In large water bodies or those of complex morphometry,
localized imbalances in nutrient concentration and trophic response may
develop ("local reactors"). In extreme cases localized symptoms of
eutrophication may develop near point sources of nutrients, in an
otherwise oligotrophic water body.
- The relationship between phosphorus and algal
chlorophyll (i.e. algal biomass) is a log-log plot of the data, and
there is considerable scatter to the linear data, indicating effects
from other factors in the pelagic environment, such as light, nitrogen,
or zooplankton grazing, in limiting algal biomass. This also indicates
that there can be wide variation in the expected chlorophyll from any
given phosphorus concentration.
- The chlorophyll a - total phosphorus ratio, an index of the efficiency of algae to utilize phosphorus varies greatly among lakes (ca.
0.05 to 0.7 in the OECD programme). A shift in algal composition and
the efficiency of phosphorus use can profoundly affect the trophic
response in a given water body.
- Macrophytes and filamentous algae are ignored in the
models, macrophytes may contain large amounts of phosphorus which is
ignored in the determination of in-lake P concentration.
- Macrophytes often act as nutrient pumps and may cause appreciable internal loading.
- Biological activity such as by bottom feeding fish and
emerging bottom dwelling invertebrate fauna often produces considerable
internal loading of nutrients.
- The presence or absence of fish and types present in a
lake can profoundly affect the apparent trophic response; in the
absence of predation highly abundant zooplankton reduce phytoplankton
by grazing which results in lower than expected chlorophyll a concentrations.
- The type of algal community can profoundly affect the
sedimentation rate of phosphorus; lakes dominated by diatoms remove
phosphorus by sedimentation at a much faster rate than lakes dominated
by more buoyant green or blue-green algae.
- In shallow unstratified lakes, the recycling and utilization of nutrients is more efficient than in deep stratified lakes.
- In reservoirs, peculiar flow regimes and hypolimnetic water withdrawal (rich in nutrients) should be taken into account.

We salute the Chebucto Community Net (CCN) of Halifax, Nova Scotia, Canada for hosting our web site, and we applaud its volunteers for their devotion in making `CCN' the best community net in the world