Disclaimer & Copyright Notices; Optimized for the MS Internet Explorer

July 26, 2006 ![]()
Excerpts from:
Dixit, S.S., Smol, J.P., Charles, D.F., Hughes, R.M., Paulsen, S.G., and Collins, G.B. 1999. Assessing water quality changes in the lakes of the northeastern United States using sediment diatoms. Can. J. Fish. Aquat. Sci. 56:131-152.
Population estimates of historical changes in limnological variables were made for all lakes of the northeast United States and also for lakes in the Adirondacks, New England Uplands, and Coastal Lowlands/Plateau ecoregions.
The population of lakes that have Cl levels <200 �eq/L has increased threefold (6-18%), whereas the population of lakes that have Cl levels <100 �eq/L has decreased by 5%.
Although the lake water pH decline is mainly due to acidic precipitation in the region, many factors may be responsible for the alkalinization of high-pH lakes.
Possible mechanisms include:
Although natural lakes in the ADIR (Adirondacks) ecoregion had experienced distinct change in lake water pH, the region has not been adversely affected by nutrient enrichment since pre-industrial time. No eutrophic lakes were detected either.
For the natural lakes of the NEU (New England Uplands) ecoregion, the population of eutrophic lakes has increased (from 2 to 4%) and of oligotrophic lakes has declined (from 41 to 38%) whereas the population of mesotrophic lakes has remained relatively unchanged (57-58%). Reservoirs in the NEU region have responded somewhat differently. The population of eutrophic sites has declined (from 22 to 9%), and both oligotrophic and mesotrophic reservoirs have increased from 12 to 17 and from 65 to 75%, respectively.
An increasing number of CLP (Coastal Lowlands/Plateau) ecoregion lakes have undergone nutrient enrichment. In natural lakes, the proportion of eutrophic and oligotrophic lakes have increased from 6 to 8 and from 48 to 63%, respectively, whereas the population of mesotrophic lakes has declined from 46 to 29% since pre-industrial/pre-European times. Although 38% of the reservoirs were eutrophic in the past, their population has increased to 46%. The populations of both oligotrophic and mesotrophic reservoirs have declined in the CLP (Coastal Lowlands/Plateau) ecoregion.
![]() Although
there are more eutrophic lakes in the northeast than in the past, the
data also suggest that there were some naturally productive lakes in
the region. Land use, land cover, physiography, soil, vegetation cover,
and bedrock and surficial geology can greatly influence the eutrophic
status of lakes. Although lakes experience changes in trophic state
naturally, the major limnological changes that have been identified in
this study are mainly due to increased human disturbances in the lakes'
drainage basins. These disturbances increase the loads of sediment and
nutrients and lead to accelerated eutrophication and water quality
degradation.
Although
there are more eutrophic lakes in the northeast than in the past, the
data also suggest that there were some naturally productive lakes in
the region. Land use, land cover, physiography, soil, vegetation cover,
and bedrock and surficial geology can greatly influence the eutrophic
status of lakes. Although lakes experience changes in trophic state
naturally, the major limnological changes that have been identified in
this study are mainly due to increased human disturbances in the lakes'
drainage basins. These disturbances increase the loads of sediment and
nutrients and lead to accelerated eutrophication and water quality
degradation.
 Forest cover:
 Planning realistic trophic state targets:
The ADIR and NEU ecoregions contained the majority of natural lakes, whereas the majority of sites in the CLP ecoregion were reservoirs. A reservoir was defined as any lake that was created by human activity, where there was probably not a lake in presettlement times.
The site selection was based on a statistical design so that the probability of including any particular site can be calculated. The 257 study sites represent the "target population" of 10,608 lakes and reservoirs in the region that are at least 1 m deep and have a surface area of 1 - 10,000 ha. Because most of these sites are <10 ha in size, a random sample of sites would have been dominated by small water bodies. This situation was corrected by varying the inclusion probability by size so that a reasonable number of large water bodies were also included. The inverse of the inclusion probability of a site is its weighting factor. By using the weighting factor, it is possible to estimate the number of sites in the target population represented by each sampled site.
19 reservoir-sites were problematic. Of the remaining 238 sites, 159 were natural lakes and 79 were reservoirs. Among the 159 natural lakes, 139 were the probability sites, representing the target population of 4638 lakes in the northeast. Among the 79 reservoirs, 78 were probability sites, representing an estimated 4906 reservoirs in the northeast.
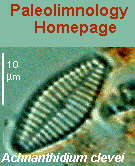
Table: Number of occurrences, maximum and mean occurrences, and weighted-averaging optima for pH, TP, and Cl for the 235 common diatom taxa found in the 309 sites (238 EMAP and 71 Adirondack PIRLA sites) in the northeastern United States
No. Taxon No. of
occurrencesOptima pH TP
(�g/L)Cl
(�eq/L)1 Achnanthes altaica 61 6.8 7 20 2 Achnanthes austriaca var. helvetica 175 7.1 10 57 3 Achnanthes bicapitata 53 7.4 10 69 4 Achnanthes clevei 12 8.1 7 244 5 Achnanthes detha 223 7.3 10 46 6 Achnanthes didyma 65 7.4 7 24 7 Achnanthes exigua 61 8.0 13 41 8 Achnanthes exigua var. hetrovelvata 15 7.8 11 85 9 Achnanthes flexella 70 7.5 9 28 10 Achnanthes hungarica 11 7.9 47 391 11 Achnanthes lanceolata 89 7.7 22 113 12 Achnanthes lanceolata var. rostrata 45 8.0 15 90 13 Achnanthes lapidosa 13 7.8 11 135 14 Achnanthes laterostrata 58 7.6 7 42 15 Achnanthes levanderi 36 7.2 8 58 16 Achnanthes linearis 164 7.6 12 53 17 Achnanthes marginulata 152 6.6 7 24 18 Achnanthes minutissima 292 7.8 13 105 19 Achnanthes peragalli 34 7.7 9 38 20 Achnanthes stewartii 14 7.5 12 152 21 Achnanthes suchlandtii 64 7.6 8 49 22 Actinella punctata 59 5.5 9 25 23 Amphora ovalis 123 8.0 22 118 24 Amphora perpusilla 30 8.3 25 592 25 Amphipleura pellucida 30 7.9 18 73 26 Anomoeoneis follis 22 6.9 9 13 27 Anomoeoneis serians var. brachysira 181 6.4 8 15 28 Anomoeoneis serians 50 5.5 6 14 29 Anomoeoneis vitrea 246 7.6 11 40 30 Asterionella formosa 209 7.6 10 128 31 Asterionella ralfsii var. americana (<45 �m) 13 5.3 21 38 32 Asterionella ralfsii var. americana (>45 �m) 135 5.8 11 24 33 Aulacoseira ambigua 241 7.5 14 89 34 Aulacoseira crassipunctata 16 5.5 23 68 35 Aulacoseira distans 169 6.6 8 24 36 Aulacoseira distans var. humilis 25 7.4 10 43 37 Aulacoseira distans var. nivalis 44 6.3 7 19 38 Aulacoseira distans var. nivaloides 109 6.9 11 28 39 Aulacoseira distans var. tenella 174 7.2 10 55 40 Aulacoseira granulata 24 7.8 29 241 41 Aulacoseira italica subsp. subarctica 75 7.5 8 70 42 Aulacoseira italica subsp. subarctica f. tenussima 13 7.9 11 180 43 Aulacoseira italica var. valida 30 7.4 13 47 44 Aulacoseira lirata f. biseriata 12 6.8 7 30 45 Aulacoseira lirata var. lacustris 43 6.5 9 19 46 Aulacoseira lirata 185 6.8 9 25 47 Aulacoseira nygaardii 100 6.5 10 21 48 Aulacoseira perglabra var. floriniae 79 6.6 7 27 49 Aulacoseira perglabra 39 6.0 5 10 50 Caloneis ventricosa 41 7.5 9 36 51 Cocconeis placentula 126 8.0 28 387 52 Cyclotella comta 200 7.4 6 44 53 Cyclotella meneghiniana 26 8.3 66 1113 54 Cyclotella michiganiana 120 8.0 9 142 55 Cyclotella ocellata 19 7.9 6 58 56 Cyclotella stelligera 285 7.3 7 59 57 Cymbella amphicephala v. hercynica 46 7.6 14 65 58 Cymbella cf. aequalis 95 7.7 12 19 59 Cymbella cesatii 55 7.8 10 19 60 Cymbella cistula 41 8.0 17 36 61 Cymbella cuspidata 53 7.4 13 35 62 Cymbella delicatula 25 8.1 8 120 63 Cymbella descripta 32 7.8 10 18 64 Cymbella cf. gaeumanii 58 6.6 8 29 65 Cymbella hebedrica 112 6.0 7 11 66 Cymbella lunata 141 7.0 9 24 67 Cymbella microcephala 135 7.9 11 34 68 Cymbella minuta f. latens 12 7.8 12 81 69 Cymbella minuta var. minuta 146 7.7 13 103 70 Cymbella minuta var. silesiaca 29 7.7 10 42 71 Cymbella cf. schubartii 36 6.5 12 21 72 Cymbella sp. 1 PIRLA 59 5.7 7 12 73 Diatoma hiemale var. mesodon 12 6.9 6 26 74 Diploneis marginestriata 62 7.7 11 56 75 Diploneis ovalis 44 7.8 10 98 76 Epithemia species 23 8.0 11 72 77 Eunotia bidentula 62 5.6 10 34 78 Eunotia bigibba var. pumila 13 5.9 10 18 79 Eunotia carolina var. 1 PIRLA 65 5.9 11 53 80 Eunotia curvata 172 6.1 9 24 81 Eunotia elegana 35 7.1 9 30 82 Eunotia exigua 127 5.9 10 20 83 Eunotia fallax 26 6.1 9 45 84 Eunotia flexuosa var. eurycephala 16 6.6 7 36 85 Eunotia flexuosa 155 7.2 12 90 86 Eunotia hemicyclus 50 5.7 9 12 87 Eunotia implicata 25 7.5 14 114 88 Eunotia incisa 210 6.8 11 41 89 Eunotia incisa var. 6 PIRLA 13 5.3 6 19 90 Eunotia intermedia 67 6.3 8 27 91 Eunotia itiarensis 39 6.3 7 16 92 Eunotia lapponica 10 4.9 8 34 93 Eunotia lunaris var. attenuata 102 6.3 12 51 94 Eunotia meisteri var. bidens 21 5.9 8 35 95 Eunotia meisteri 37 5.5 7 19 96 Eunotia microcephala 22 6.4 14 91 97 Eunotia monodon 94 7.3 14 104 98 Eunotia naegelii 65 6.7 16 125 99 Eunotia pectinalis var. minor 71 6.6 13 40 100 Eunotia pectinalis 86 6.7 10 46 101 Eunotia pectinalis var. ventricosa 162 7.1 17 140 102 Eunotia praerupta 62 6.8 10 29 103 Eunotia rhomboidea 120 6.1 9 24 104 Eunotia serra 38 5.8 11 39 105 Eunotia vanheurckii 82 6.5 9 30 106 Eunotia zasuminensis 58 6.9 11 54 107 Eunotia sp. 1 PIRLA 19 6.1 11 78 108 Eunotia sp. 2 PIRLA 33 6.4 10 55 109 Fragilaria acidobiontica 32 4.9 3 8 110 Fragilaria brevistriata 184 7.7 13 49 111 Fragilaria brevistriata var. capitata 52 7.7 10 61 112 Fragilaria capucina var. mesolepta 22 8.3 46 362 113 Fragilaria constricta 71 6.3 10 23 114 Fragilaria constricta f. stricta 19 7.7 12 221 115 Fragilaria construens var. binodis 72 7.4 9 32 116 Fragilaria construens 108 7.9 13 42 117 Fragilaria construens var. venter 48 7.3 8 15 118 Fragilaria crotonensis 149 8.0 14 194 119 Fragilaria hungarica var. tumida 49 5.7 18 25 120 Fragilaria lata 26 5.9 8 14 121 Fragilaria leptostauron 11 8.4 15 90 122 Fragilaria cf. oldenburgiana 78 6.2 6 18 123 Fragilaria pinnata var. acuminata 128 7.6 14 89 124 Fragilaria pinnata var. intercedens 19 8.3 18 72 125 Fragilaria pinnata var. lancettula 43 7.8 8 62 126 Fragilaria pinnata 241 7.6 14 57 127 Fragilaria vaucheriae 138 7.8 20 166 128 Fragilaria virescens var. exigua 172 7.0 9 37 129 Fragilaria virescens 46 6.9 14 38 130 Fragilaria sp. 2 PIRLA 31 8.2 21 89 131 Frustulia cf. magaliesmontana 81 5.5 6 13 132 Frustulia rhomboides 143 6.2 9 32 133 Frustulia rhomboides var. saxonica 204 6.1 9 22 134 Gomphonema acumenatum 72 7.6 14 54 135 Gomphonema angustatum 170 7.6 15 109 136 Gomphonema gracile 77 6.9 18 113 137 Gomphonema subtile var. sagitta 12 8.0 9 10 138 Gomphonema sp. 1 PIRLA 12 7.2 7 62 139 Gyrosigma acumenatum 43 8.2 27 65 140 Gyrosigma obscurum 10 8.0 21 690 141 Krasskela kriegeriana 20 7.4 10 35 142 Meridion circulare 32 8.0 14 104 143 Meridion circulare var. constricta 47 7.6 14 118 144 Navicula arvensis 72 7.2 14 69 145 Navicula bacillum 30 8.0 43 52 146 Navicula bremensis 46 6.2 7 13 147 Navicula cf. capitata 18 8.1 13 326 148 Navicula cocconeiformis 88 7.2 8 29 149 Navicula cryptocephala 62 8.1 23 104 150 Navicula cuspidata 26 8.1 53 329 151 Navicula disjuncta 82 7.5 12 64 152 Navicula explanata 36 7.7 11 33 153 Navicula globosa 24 8.1 10 41 154 Navicula gysingensis 48 7.4 18 105 155 Navicula halophila 16 8.4 12 465 156 Navicula cf. heimansii 124 6.6 8 23 157 Navicula laevissima 31 7.1 11 17 158 Navicula mediocris 100 6.5 10 23 159 Navicula minima 159 7.4 11 52 160 Navicula modica 113 7.7 14 36 161 Navicula mutica 29 7.6 11 120 162 Navicula pseudoscutiformis 89 7.3 9 34 163 Navicula pupula 220 7.5 13 41 164 Navicula pupula var. rectangularis 37 7.5 12 34 165 Navicula radiosa var. parva 171 7.8 16 43 166 Navicula radiosa 88 7.9 12 40 167 Navicula radiosa var. tenella 104 8.0 11 50 168 Navicula rhyncocephala 88 8.0 20 253 169 Navicula seminuloides 142 7.4 9 31 170 Navicula submolesta 56 7.3 12 161 171 Navicula subtilissima 88 6.4 10 17 172 Navicula tenuicephala 42 5.0 3 8 173 Navicula trivialis 12 8.1 33 147 174 Navicula vitiosa 167 7.4 11 38 175 Navicula vulpina 13 7.9 9 14 176 Navicula sp. 2 PIRLA 12 7.9 9 54 177 Navicula sp. 25 PIRLA 26 7.4 15 107 178 Neidium affine 145 6.0 9 14 179 Neidium bisulcatum 38 6.5 9 32 180 Neidium iridis var. amphigomphus 99 6.5 13 36 181 Neidium iridis var. ampliatum 10 7.1 11 20 182 Neidium iridis 95 6.9 13 38 183 Nitzschia acicularis 31 8.0 14 66 184 Nitzschia amphibia 17 8.1 19 80 185 Nitzschia angustata 18 7.7 15 163 186 Nitzschia denticula 26 8.1 7 70 187 Nitzschia dissipata 109 7.8 14 77 188 Nitzschia fonticola 83 7.7 11 20 189 Nitzschia gracilis 214 7.6 15 77 190 Nitzschia linearis 10 7.6 10 45 191 Nitzschia microcephala 12 7.4 8 22 192 Nitzschia palea 82 7.8 18 134 193 Nitzschia perminuta 35 7.3 12 45 194 Pinnularia abaujensis 103 6.7 11 25 195 Pinnularia abaujensis var. rostrata 24 7.3 14 13 196 Pinnularia abaujensis var. 2 PIRLA 77 6.1 7 10 197 Pinnularia biceps 116 6.8 10 19 198 Pinnularia borealis 15 7.8 30 154 199 Pinnularia braunii 69 6.7 12 41 200 Pinnularia hilseana 13 6.3 10 35 201 Pinnularia maior 22 7.0 15 47 202 Pinnularia mesolepta 34 7.1 10 22 203 Pinnularia microstauron 50 6.5 11 15 204 Pinnularia pogoii 37 6.2 14 20 205 Pinnularia polyonca 25 7.1 13 33 206 Pinnularia subcapitata 70 6.1 13 25 207 Pinnularia viridis 71 7.1 13 30 208 Pinnularia sp. 11 PIRLA 41 5.5 9 8 209 Stauroneis anceps 73 6.9 11 24 210 Stauroneis anceps f. gracilis 128 7.0 11 36 211 Stauroneis nobilis var. baconiana 36 7.4 11 44 212 Stauroneis phoenicenteron 144 7.3 14 38 213 Stenopterobia intermedia 151 6.4 8 23 214 Stephnodiscus hantzschii 16 8.4 34 540 215 Stephnodiscus niagrae 28 8.1 16 296 216 Stephnodiscus species 11 8.4 33 1036 217 Surirella delicatissima 129 5.8 7 14 218 Surirella linearis 80 7.2 19 37 219 Surirella sp. 2 PIRLA 17 7.0 3 122 220 Synedra acus 25 7.7 15 127 221 Synedra acus var. angustissima 30 8.0 22 110 222 Synedra delicatissima 72 7.8 9 85 223 Synedra famelica 99 7.7 13 170 224 Synedra filiformis var. exilis 37 7.5 9 75 225 Synedra parasitica 69 7.8 18 250 226 Synedra pulchella 24 7.9 48 683 227 Synedra rumpens var. familiaris 93 7.7 25 180 228 Synedra ulna 133 7.9 15 126 229 Tabellaria binalis 27 5.5 5 10 230 Tabellaria fenestrata 86 7.5 13 50 231 Tabellaria flocculosa var. linear 171 7.1 10 39 232 Tabellaria flocculosa strain III 229 7.0 9 43 233 Tabellaria flocculosa strain IIIp 236 7.2 8 50 234 Tabellaria flocculosa strain IV 205 6.8 9 38 235 Tabellaria quadriseptata 90 5.5 11 30
Note: Taxa listed here were present in at least 10 sites and had an abundance of 1% in at least one site.

We salute the Chebucto Community Net (CCN) of Halifax, Nova Scotia, Canada for hosting our web site, and we applaud its volunteers for their devotion in making `CCN' the best community net in the world!